
Percentiles Quartiles and Interquartile Range Explained
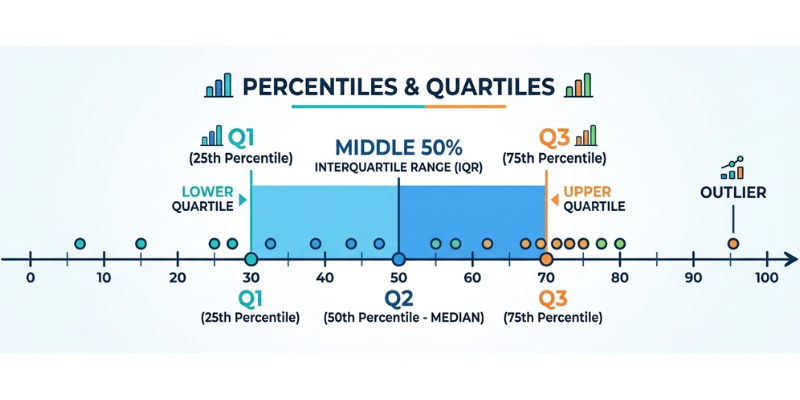
Understanding how data is distributed is an important part of data science and statistics. When you work with a large dataset, an average alone may not tell you enough about the values. Percentiles, quartiles, and the interquartile range help you understand where values fall within a dataset and how widely the data is spread. If you want to build a strong foundation in data science, you can enroll in a Data Science Course in Trivandrum at FITA Academy to develop practical knowledge step by step.
What Are Percentiles
A percentile shows the position of a particular value compared with the rest of the data. It tells you the percentage of values that are at or below a specific point. For example, if a student's score is at the 80th percentile, the student scored as well as or better than approximately 80 percent of the scores in the dataset.
Percentiles are useful when you want to compare individual values within a larger group. They are commonly used in exam results, salary analysis, health measurements, and performance reports. Unlike an average, a percentile provides information about the relative position of a value within the complete dataset.
Understanding Quartiles
Quartiles divide an ordered dataset into four approximately equal sections. Each section represents about 25 percent of the observations. The three main quartiles are called Q1, Q2, and Q3.
Q1 is the first quartile and represents the point below which about 25 percent of the data falls. Q2 is the second quartile and is also known as the median. It divides the dataset into two equal parts. Q3 is the third quartile and represents the point below which about 75 percent of the data falls.
Quartiles make it easier to understand the overall distribution of numerical data. They are especially helpful when datasets contain values that are very different from one another.
What Is the Interquartile Range
The interquartile range, commonly called IQR, measures the spread of the middle 50 percent of a dataset. It is calculated by subtracting Q1 from Q3.
IQR = Q3 − Q1
For example, suppose Q1 is 25 and Q3 is 60. The IQR would be 35. This means that the middle half of the observations is spread across a range of 35 units.
One major advantage of the IQR is that it is less affected by extremely high or low values. This makes it useful for datasets where outliers may influence other measures of spread.
Percentiles and Quartiles in Data Analysis
Percentiles and quartiles are widely used during exploratory data analysis. They can help data scientists understand the distribution of variables before selecting a statistical method or machine learning approach.
A box plot is one of the most common visual tools for displaying quartiles and the IQR. It usually shows Q1, the median, Q3, and potential outliers. Looking at these values together can quickly reveal whether data is concentrated in a particular range or spread across a wider area.
These concepts are also useful for comparing different groups. For example, a data scientist could compare the income quartiles of two cities to understand how their income distributions differ. If you want to strengthen your practical data analysis skills, consider taking a Data Science Course in Kochi to explore these statistical concepts through hands-on learning.
How the IQR Helps Identify Outliers
The IQR can also help identify unusually high or low observations. A common approach uses 1.5 times the IQR as a boundary around the middle 50 percent of the data.
The lower boundary is calculated by subtracting 1.5 times the IQR from Q1. The upper boundary is calculated by adding 1.5 times the IQR to Q3. Values outside these boundaries may be considered potential outliers.
However, an outlier is not automatically an error. It may represent a genuine observation that deserves further investigation. Data scientists should understand the reason behind unusual values before deciding whether to remove or change them.
Why These Concepts Matter in Data Science
Percentiles, quartiles, and IQR are simple statistical concepts, but they are valuable tools for understanding real-world datasets. They help summarize distributions, compare groups, detect potential outliers, and understand the spread of data.
Learning these concepts also makes more advanced statistical and machine learning topics easier to understand. When you can interpret how data is distributed, you can make better decisions during data cleaning, exploratory analysis, and model preparation.
Percentiles indicate the relative standing of values, quartiles split data into four parts, and the IQR assesses the range of the central half of a dataset. Together, they provide a clearer picture of data distribution than a single average can provide. If you are ready to expand your statistical and analytical skills, join a Data Science Course in Pune to continue learning these essential concepts through practical applications.
Also check: Sources of Data and How to Choose the Right One

 Polish
 English
 Arabic
 Spanish
 Portuguese
 Deutsch
 Turkish
 Dutch
Dutch
 Italiano
 Russian
 Romaian
 Portuguese (Brazil)
 Greek
Greek